Gas SOS Department Employee Application
Gas emergency technicians rely on fast, accurate communication, but the old mobile app made that hard. I redesigned it as a map-first, glove-friendly tool for real vehicles, real stress, real gloves.
Project Overview
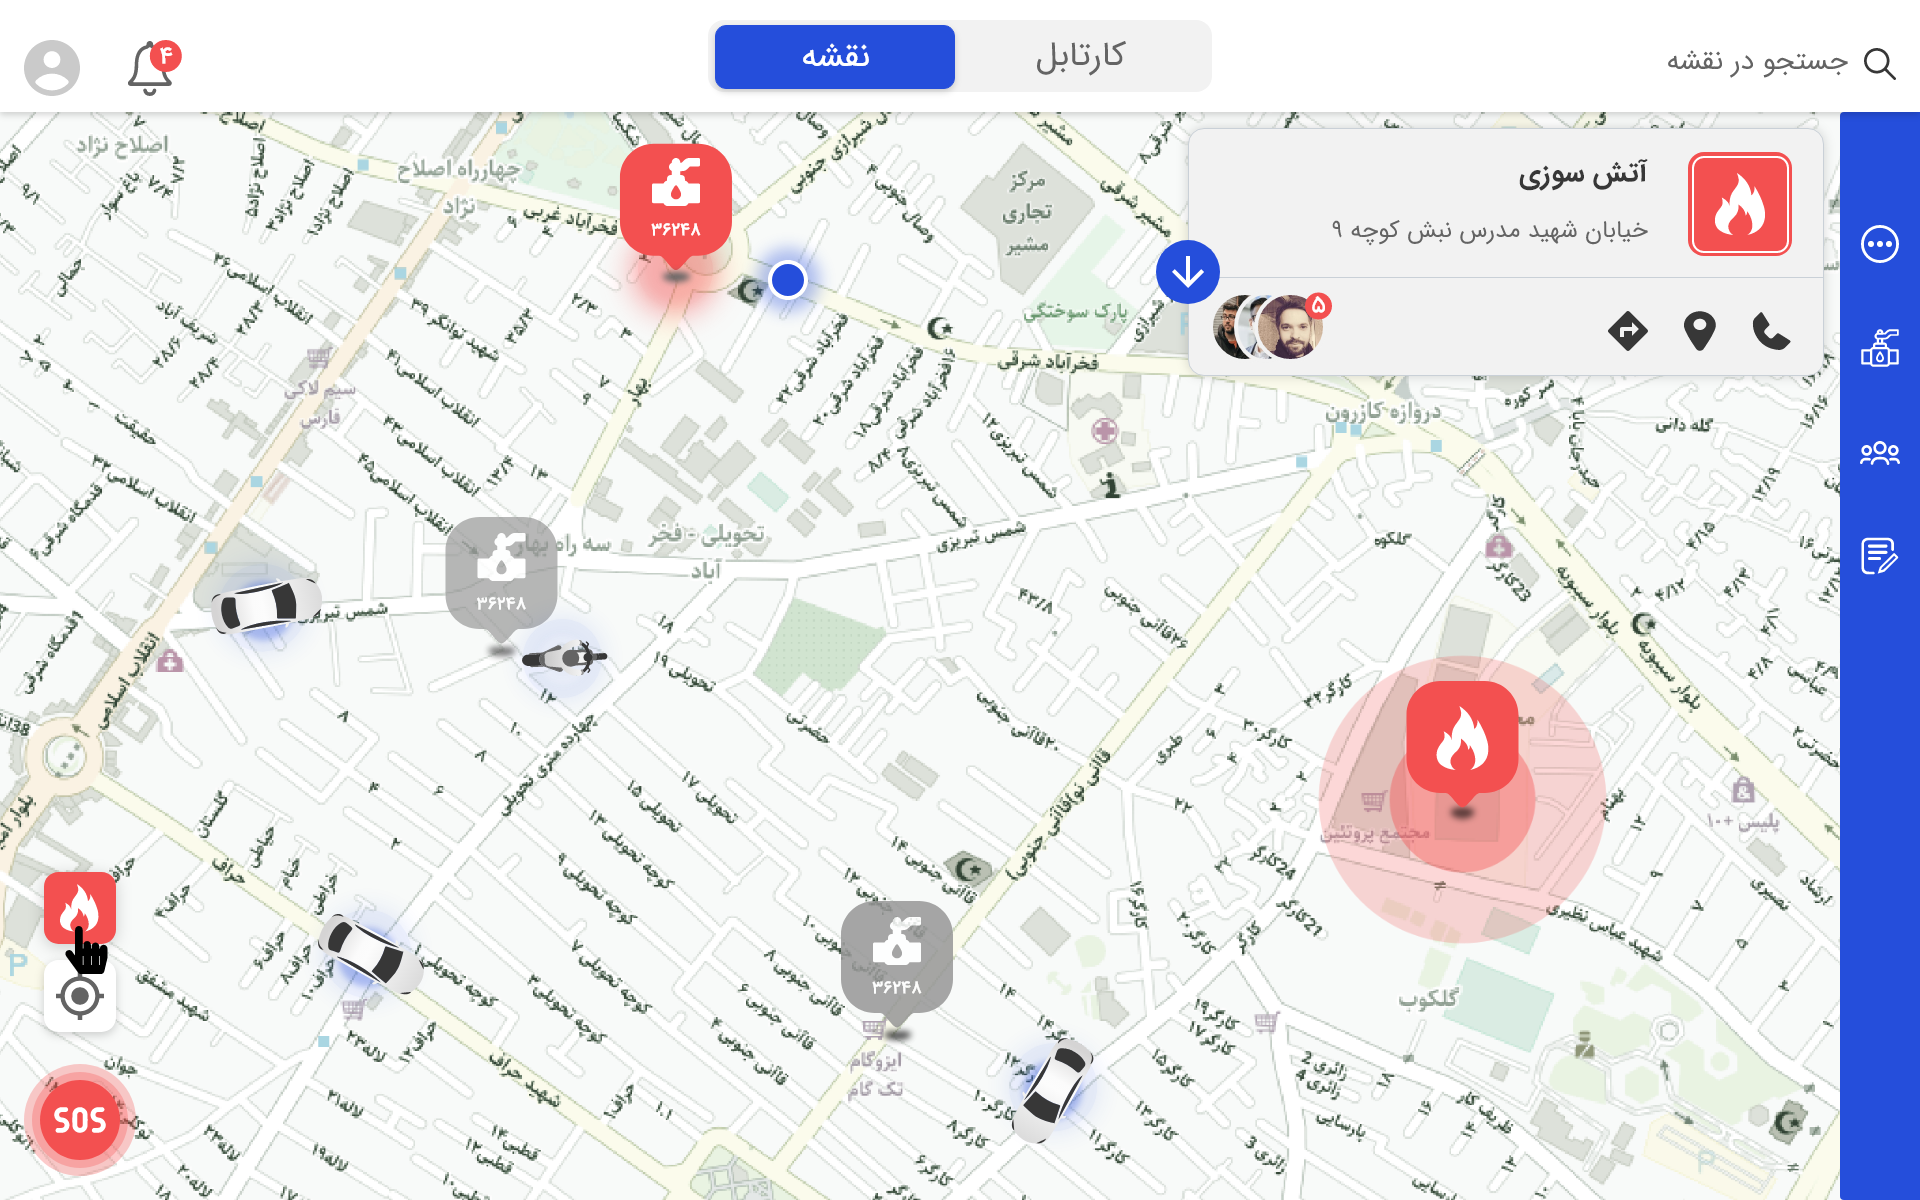
The Gas SOS Department Application replaced a minimal, outdated app used by municipal safety teams. The old version had tiny buttons, long forms, and poor visibility on the map, making it difficult to use inside vehicles, especially when employees wore gloves.
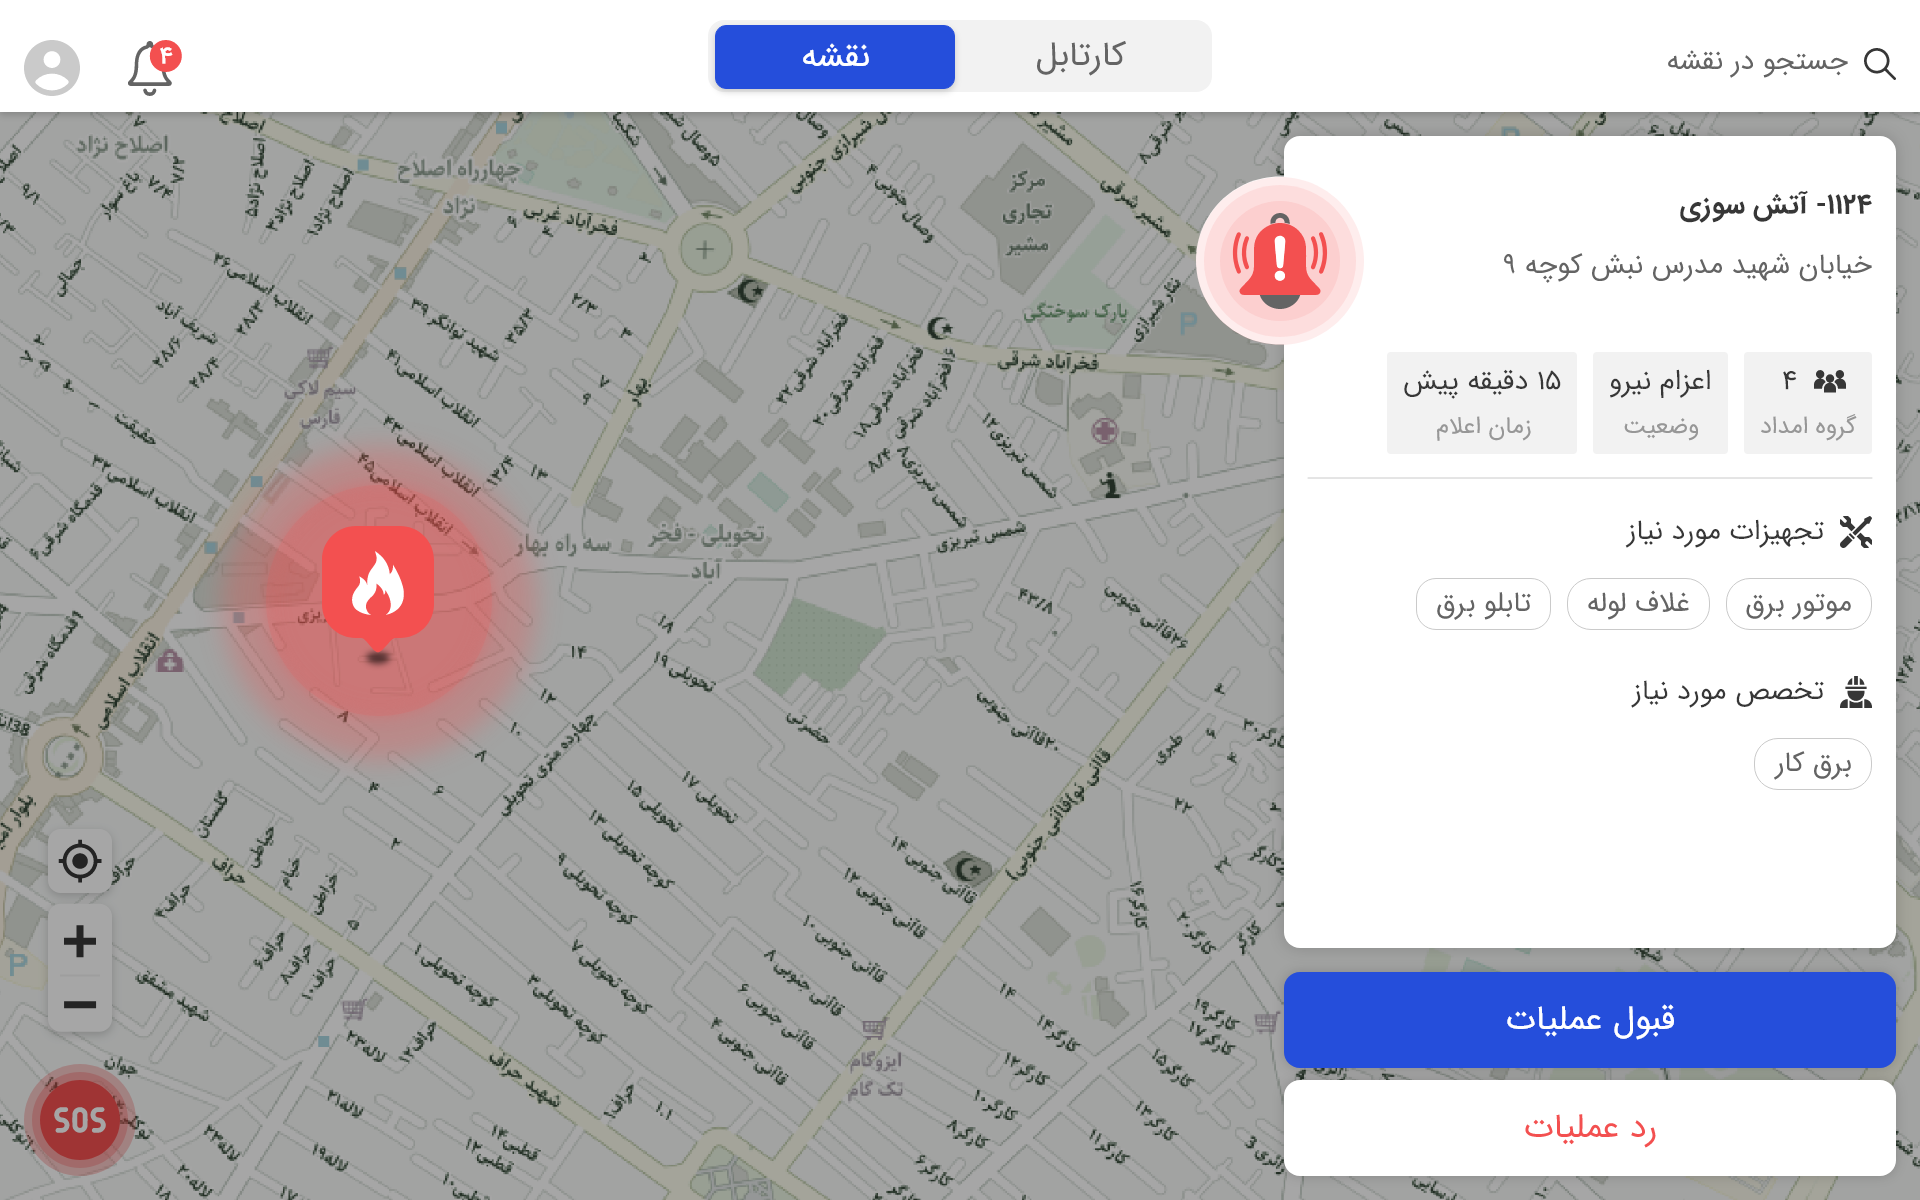
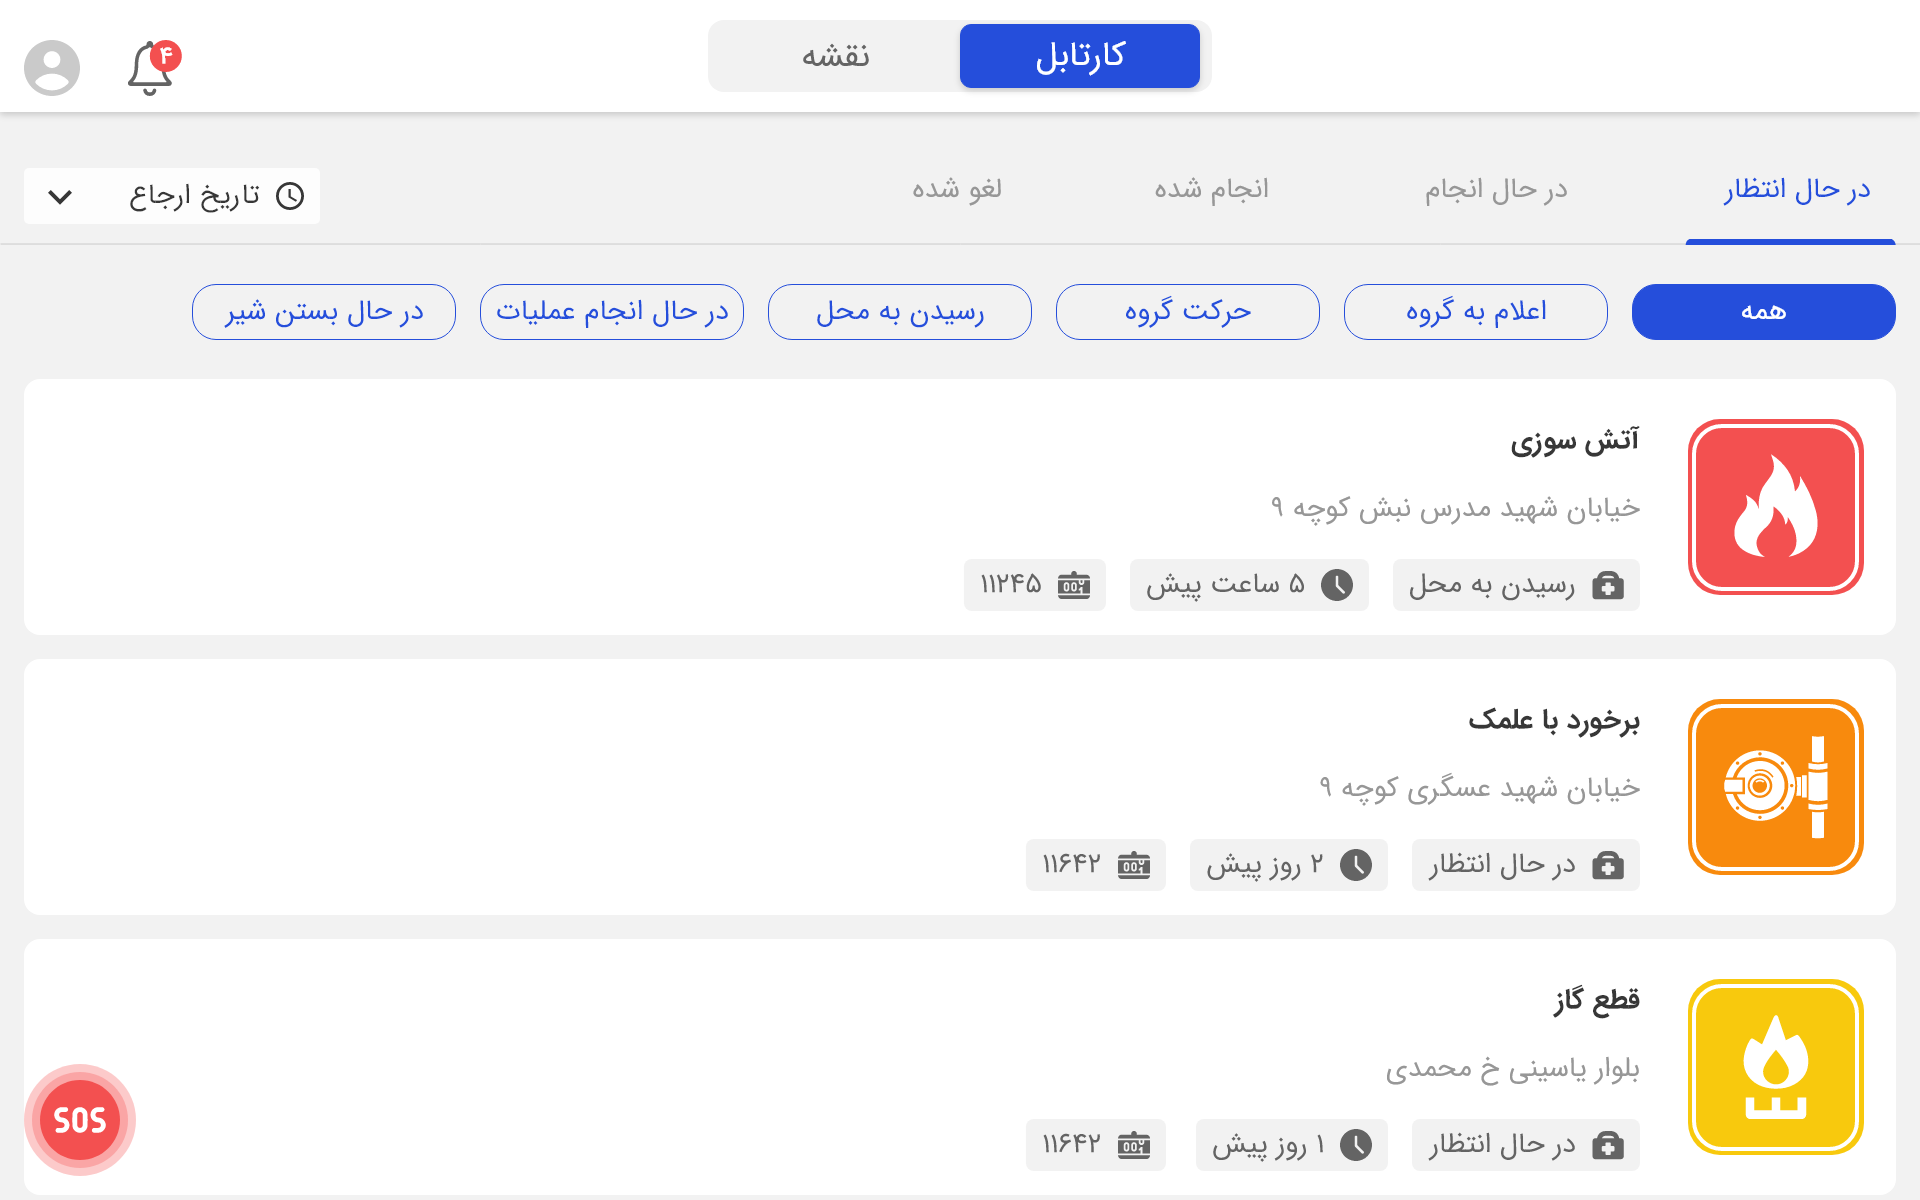
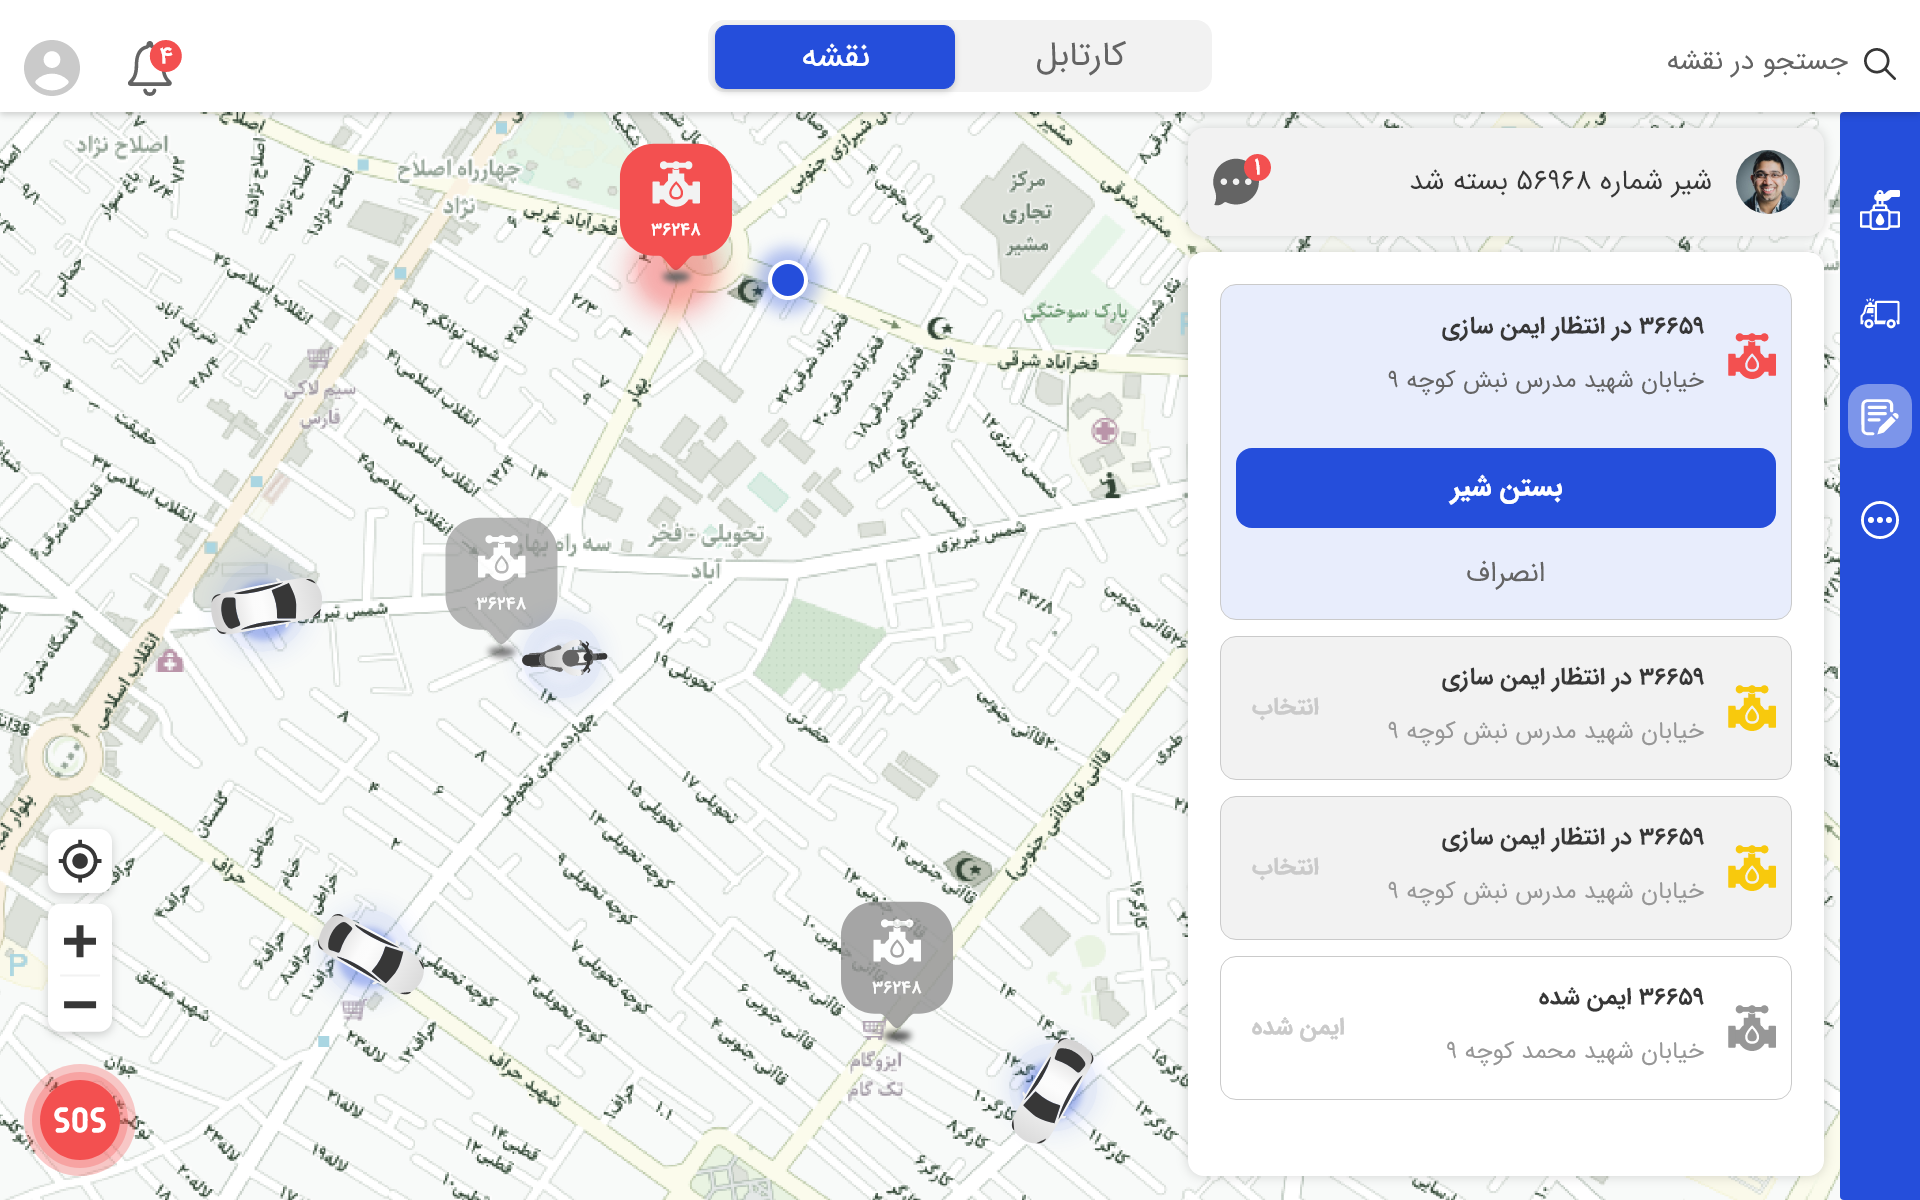
The redesign introduced a map-centered interface optimized for tablet use in vehicles, with real-time incident tracking, simplified reporting, and clear prioritization by severity level.
My Role
As UX/UI Designer, I owned end-to-end design, research, ideation, prototyping, testing, and handoff, and collaborated with 2 developers, 1 PM, and 3 field engineers. I designed for the tablet interface in both landscape and portrait, and built the visual system and design documentation for development handoff.
Design Problem
It required many steps to log an incident, buttons were too small for gloves, and maps often froze or failed to update. This led to slow reporting, confusion, and delays in emergency response.
Project Goals
The primary design goals were focused on improving speed, clarity, and field usability.
| Goal | Description | Expected outcome |
|---|---|---|
| Enable real-time tracking | Continuous updates of gas leaks and field team locations through a live map | Faster detection and coordination across teams |
| Simplify report submission | Fewer steps and fields; auto-fill location and technician info | Less user fatigue, faster entry, improved completion |
| Prioritize by severity & proximity | Visual indicators (red/yellow/green) and GPS data to rank urgency | More efficient resource allocation, faster response |
| Design for glove use & vehicles | Large buttons, high-contrast visuals, minimal navigation | Increased safety and usability during fieldwork |
| Improve data accuracy | Inline validation, offline syncing, confirmation states | Higher-quality reports, fewer inconsistencies |
Research & Discovery
1. Stakeholder interviews
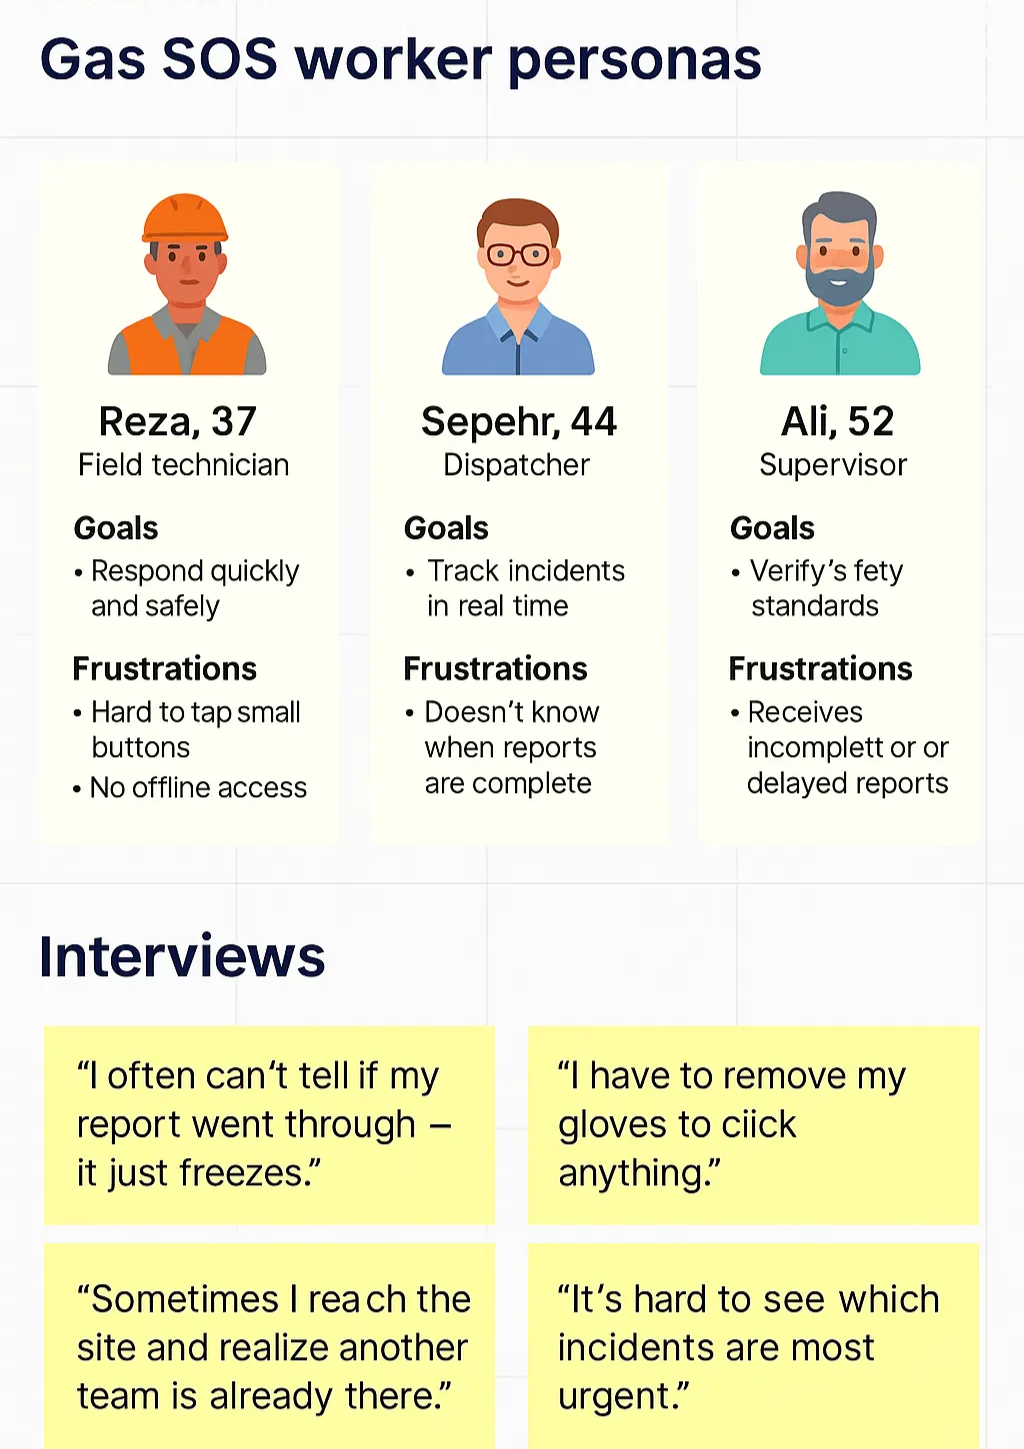
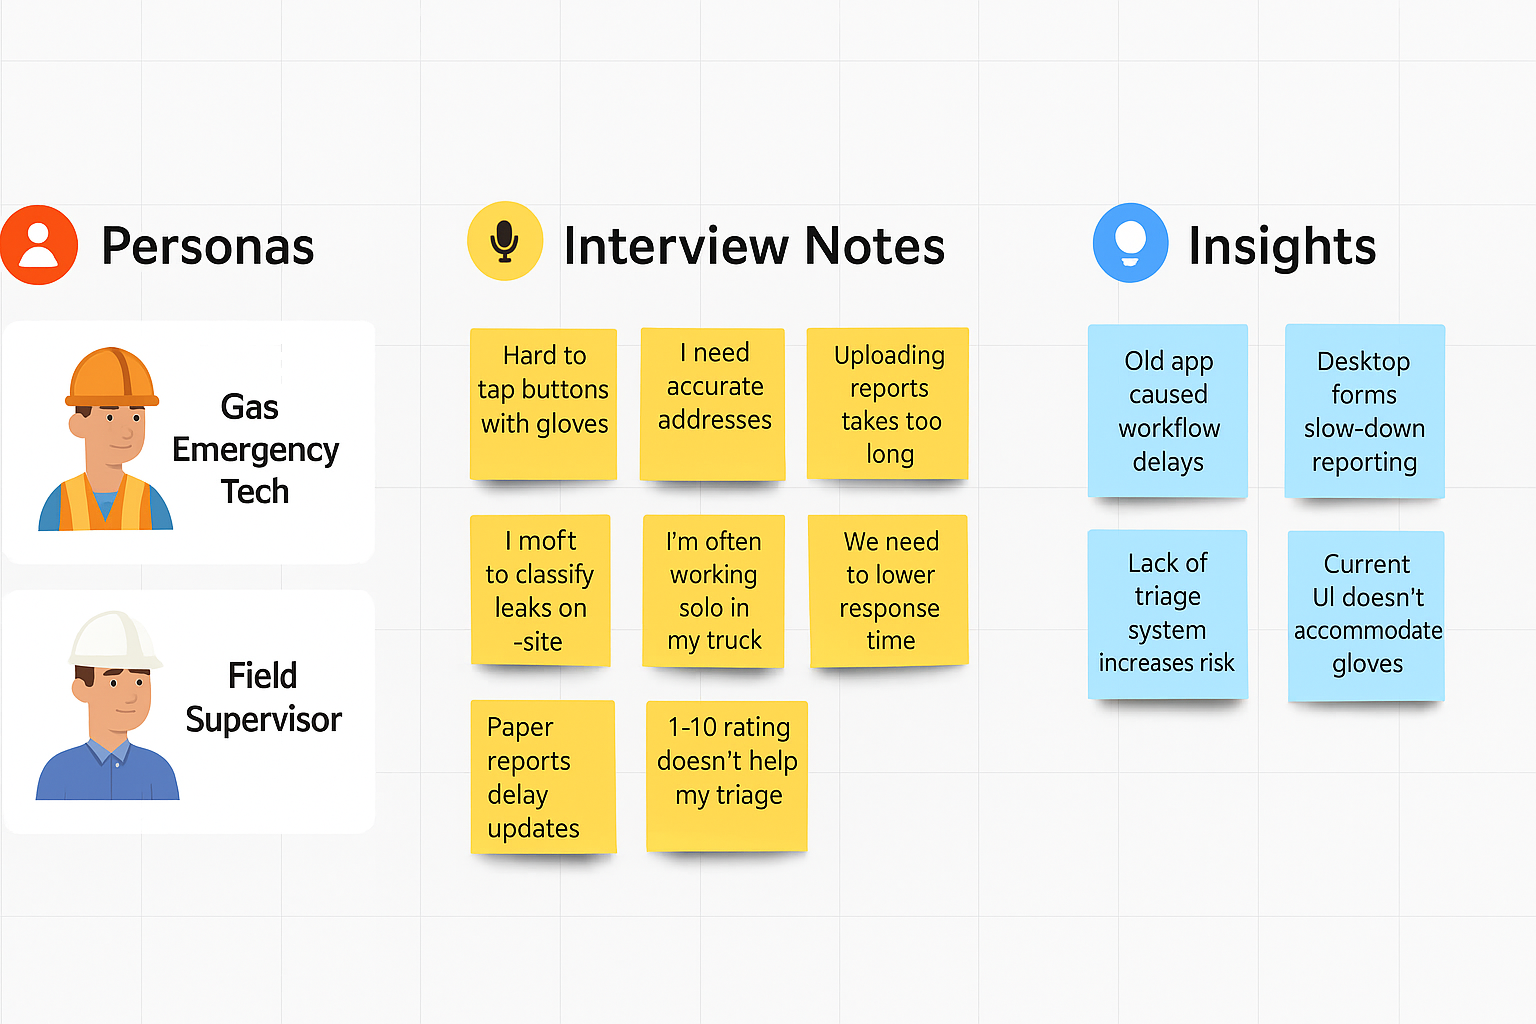
I interviewed supervisors, technicians, and dispatchers to understand workflows. Technicians worked mostly from vehicles, often using one hand. Reports were delayed by long forms and manual uploads. Dispatchers needed visibility into which technician handled which alert.
2. Field observation
I joined technicians on ride-alongs to observe real usage. Harsh lighting made on-screen elements hard to see. Physical gloves prevented small touch interactions. Network coverage was unreliable, making offline mode essential.
These personas and interviews helped identify usability challenges in the field and shaped the core design priorities.
3. Competitive & comparative analysis
Benchmarking existing SOS and emergency-response tools showed that top performers used large visual elements and priority colors, focused on map-first design, and allowed instant updates even with weak connectivity.
Design Strategy
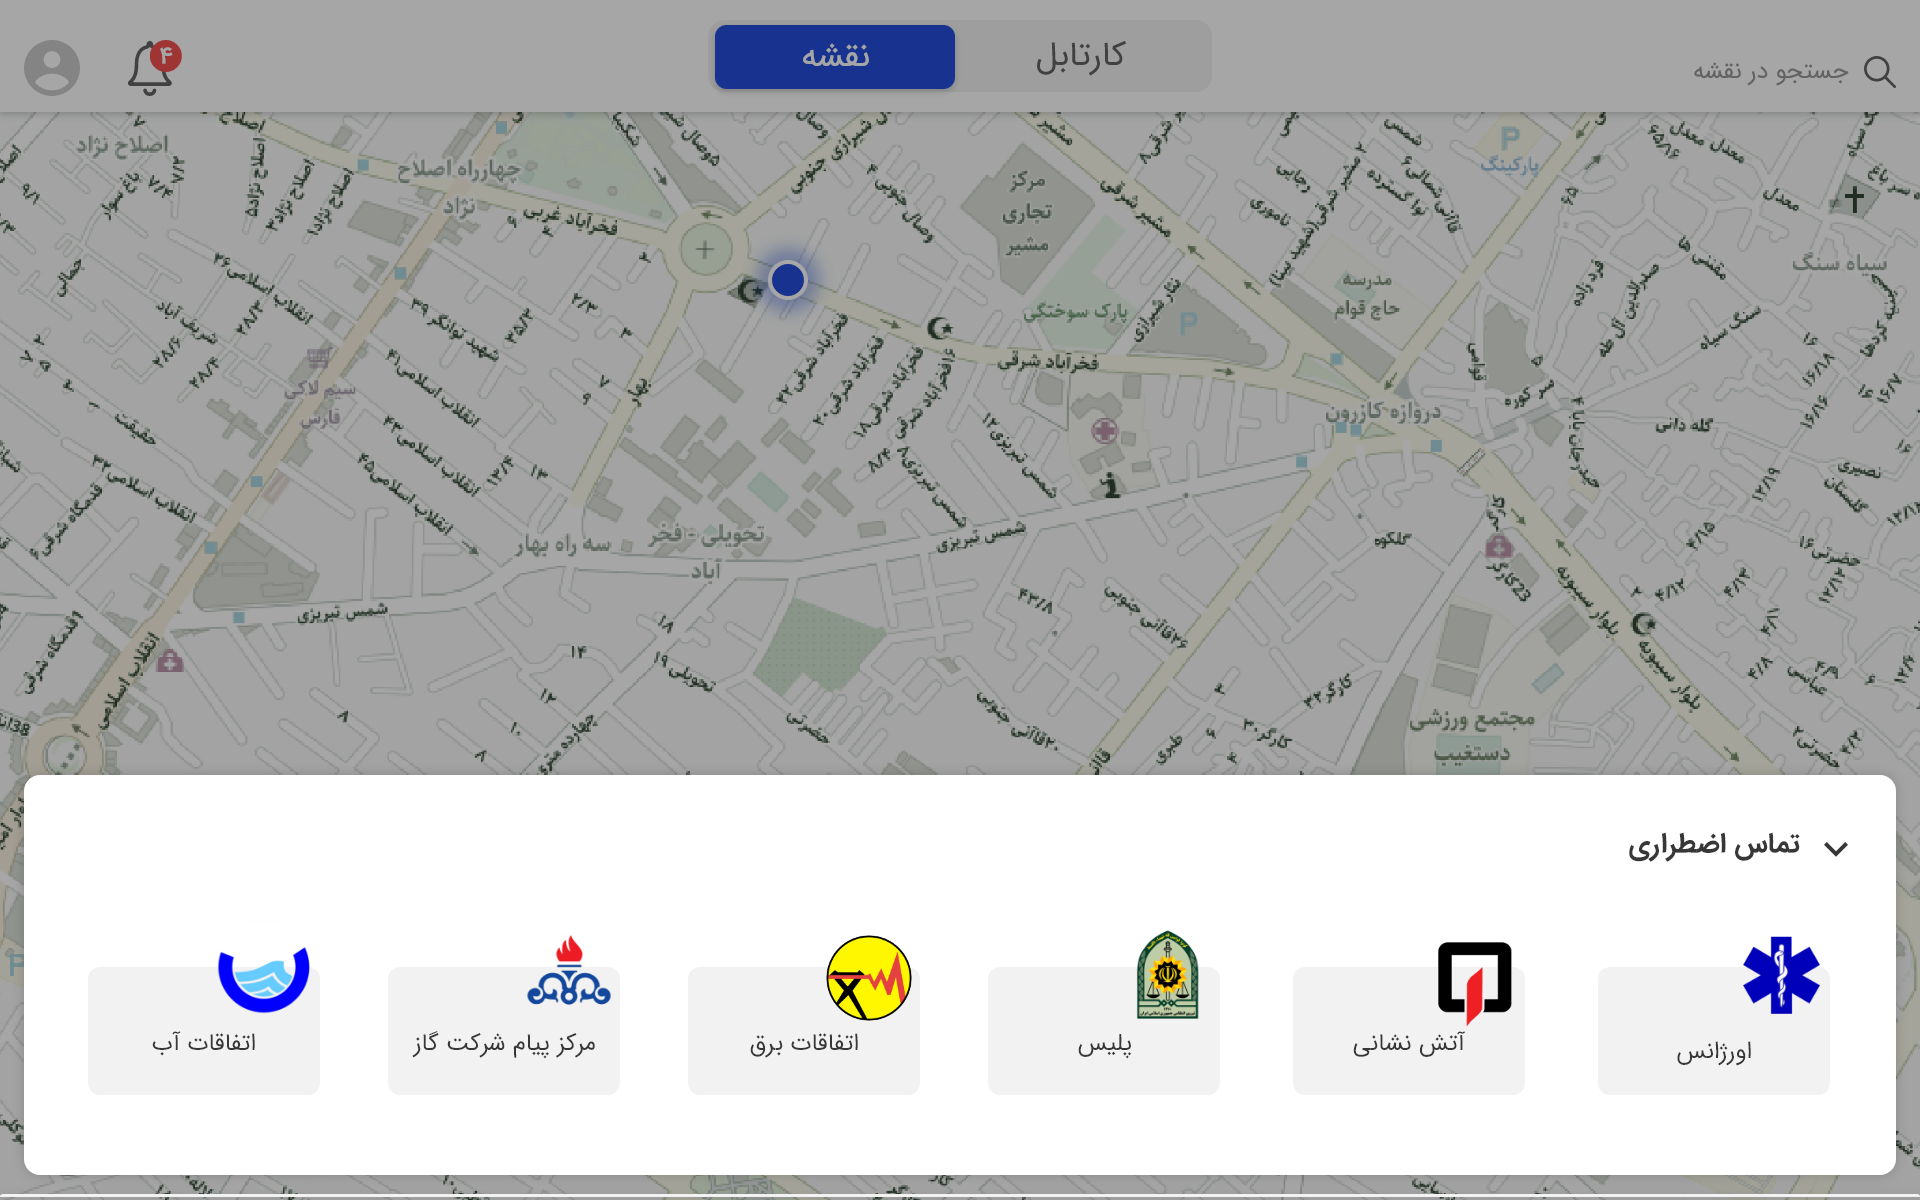
- Map-first interface: the map became the central interaction hub
- Prioritized simplicity: fewer forms, fewer taps, faster confirmation
- Accessibility under stress: big buttons, bold colors, clear feedback
- Glove-friendly controls: tap zones expanded to 80px minimum
- Offline-first logic: cached reports sync automatically when back online
Design Process
- Define. Identified core workflows: report → locate → verify → close. Created a persona, Reza, 37, a field engineer who spends most of his day driving.
- Ideate. Brainstormed with engineers using whiteboard sketches; proposed auto-fill forms, offline sync, and risk badges.
- Prototype. Built mid-fidelity wireframes, then high-fidelity mockups in Figma, using large visual icons for alert, report, confirm, and close actions.
- Test. Conducted usability tests with 10 participants (mixed roles), recording sessions and tracking completion time and errors.
Key features
- Real-time tracking: auto-refreshes incidents every 30 seconds
- Risk-based prioritization: visual hierarchy for fast decision-making
- Offline sync: keeps working during disconnections
- Voice notes + quick upload: reduces typing effort
- Large UI elements: for glove use and fast tapping
Designs
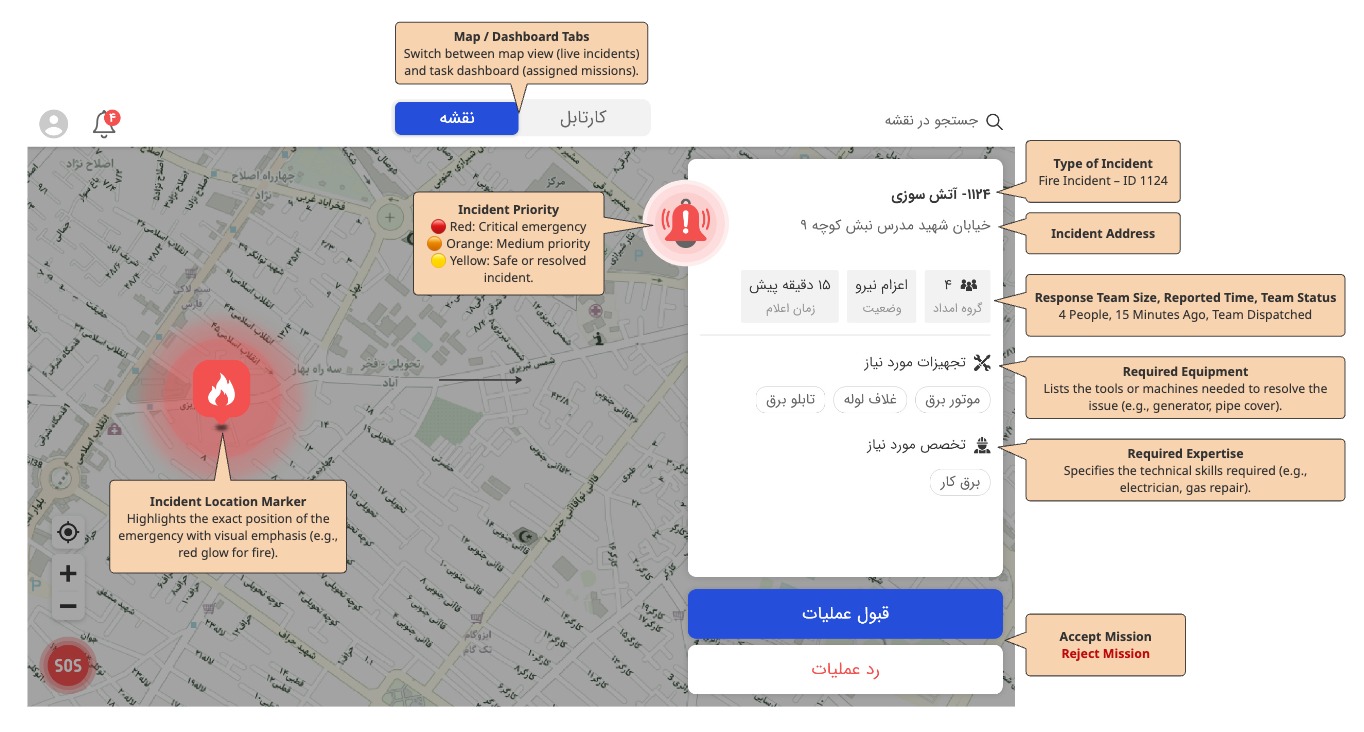
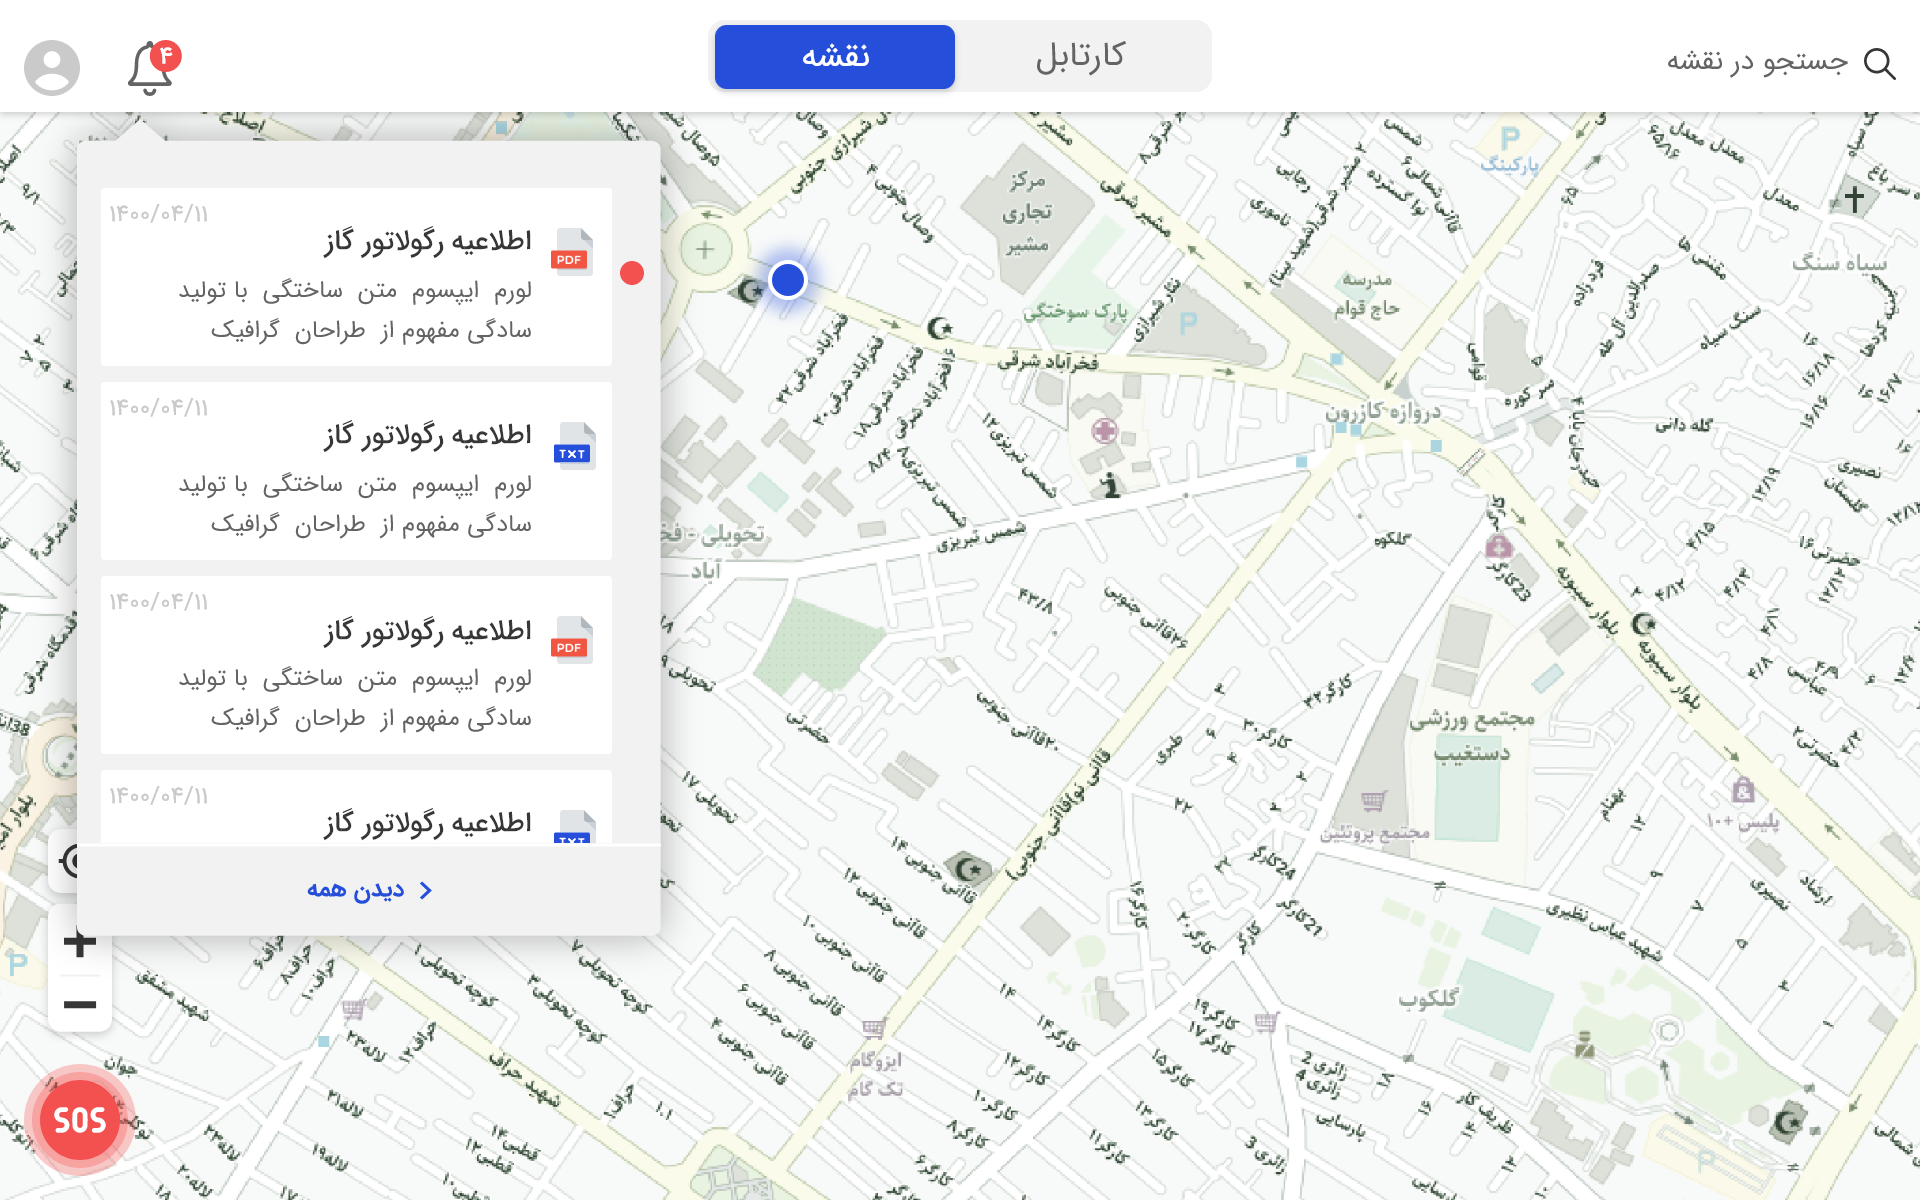
The final interface focuses on clarity under stress, with real-time map visibility, clear prioritization, and minimal cognitive load.
Reflection & Takeaways
This project reminded me that designing for real-world, high-pressure environments means thinking beyond the screen. I learned how to empathize with users working in tough conditions, wearing gloves, under stress, often on the move. Balancing clarity, accessibility, and technical constraints became key to creating something reliable and fast. I also realized how much impact small details, like autosave, quick feedback, or larger tap areas, can have on user confidence when every second counts.